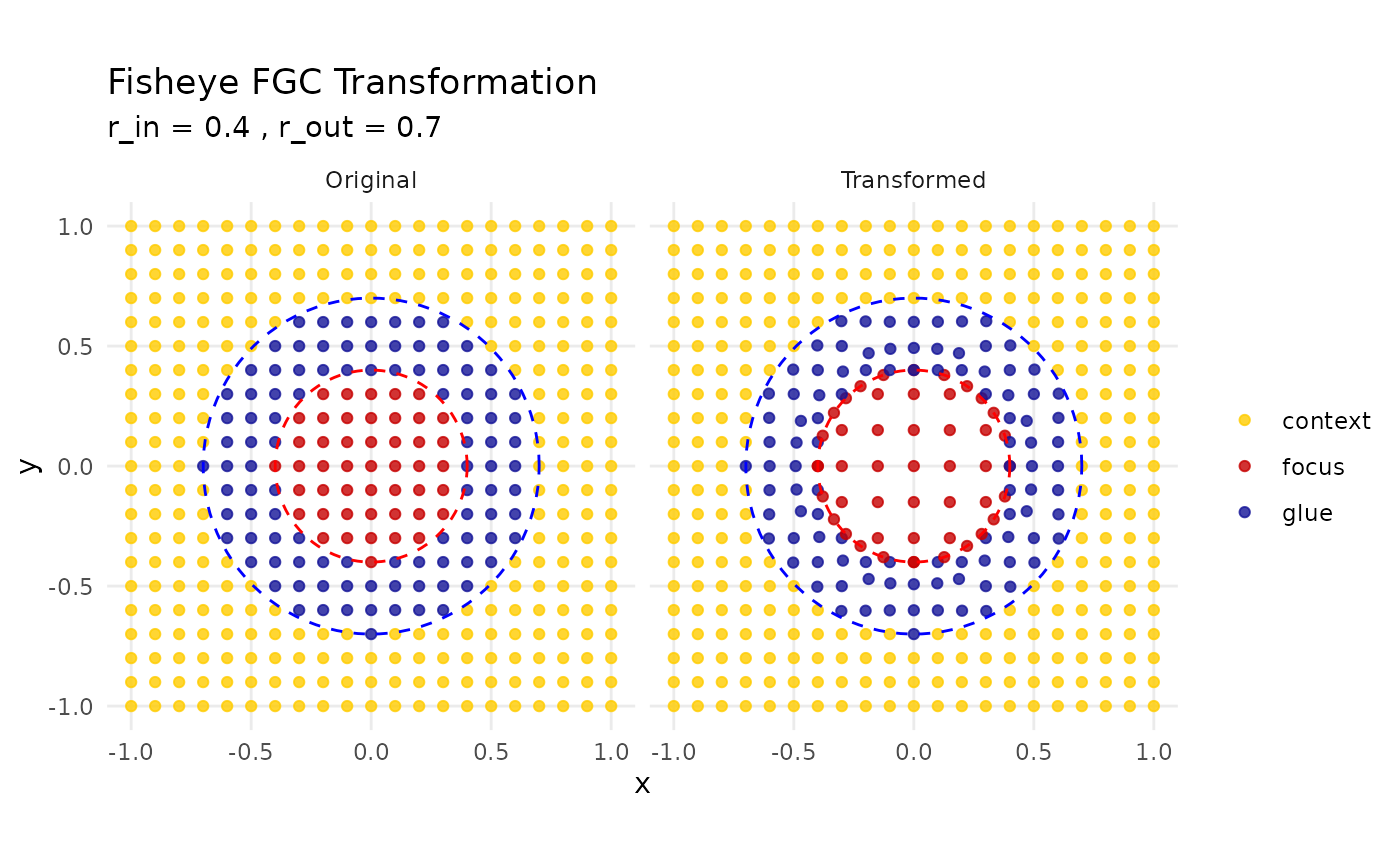
Creates a side-by-side scatterplot comparing the original and transformed coordinates of a dataset under the Focus–Glue–Context fisheye mapping. Points are colored according to whether they fall in the focus, glue, or context zones, and boundary circles are drawn for clarity.
Usage
plot_fisheye_fgc(
  original_coords,
  transformed_coords,
  cx = 0,
  cy = 0,
  r_in = 0.34,
  r_out = 0.5
)
Arguments
- original_coords
A matrix or data frame with at least two columns representing the original
(x, y)coordinates.- transformed_coords
A matrix or data frame with the transformed
(x, y)coordinates (same number of rows asoriginal_coords).- cx, cy
Numeric. The x and y coordinates of the fisheye center (default = 0, 0).
- r_in
Numeric. Radius of the inner focus boundary (default = 0.34).
- r_out
Numeric. Radius of the outer glue boundary (default = 0.5).
Value
A ggplot2 object showing original vs transformed
coordinates, colored by zone, with boundary circles
overlaid.
Examples
library(ggplot2)

# Generate test grid and apply fisheye
grid <- create_test_grid(range = c(-1, 1), spacing = 0.1)
warped <- fisheye_fgc(grid, r_in = 0.4, r_out = 0.7)

# Visualize transformation
plot_fisheye_fgc(grid, warped, r_in = 0.4, r_out = 0.7)